Organization Chart with AngularJS
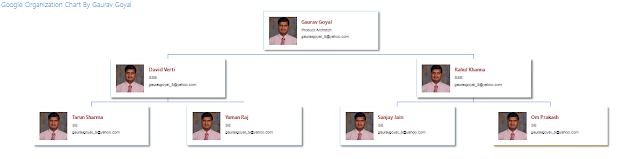
What is Organization Chart? An Organizational Chart shows the internal structure of an organization or company. The employees and positions are represented by boxes or other shapes, sometimes including photos, contact information, email and page links, icons and illustrations. Straight or elbowed lines link the levels together. This creates a clear visual depiction of the hierarchy and ranks of different people, jobs and departments that make up the organization. Organizational Charts also are known as Organization Charts, Org Charts, Organograms, Organogram Charts (sometimes spelled Organigrams or Organigrammes) and Hierarchy Charts. Don’t be fooled: Despite all the different names, they’re all the same thing. How to create with angularjs & google chart? First you need to create one JS file: OrgChart.JS & copy below text : var app = angular.module( 'OrgChartApp' , []); app.controller( 'OrgChartController' , [ '$scope' , ...